前回は熱伝導方程式を2次元に拡張し、プログラム内で2次元データを扱う方法を説明しました。
今回はこのシリーズの最終回です。プログラムを完成させて2次元平面で熱が伝わっていく様子をアニメーションにしてみます。
目次
プログラム
import matplotlib.pyplot as plt
import matplotlib.animation as animation
import numpy as np

# input parameter
den = 8880.0
cp = 386.0
cond = 398.0
temp_bc = 100.0
temp_init = 0.0
lx = 1.0
ly = 1.0
nx = 51
ny = 51
tend = 10000.0
dt = 1.0
tout = 50.0
eps = 1.0e-6
itermax = 1000

alpha = cond / (den * cp)
dx = lx / (nx - 1)
dy = ly / (ny - 1)
nt = int(tend / dt)
nout = int(tout / dt)

ckx = alpha * dt / (dx * dx)
cky = alpha * dt / (dy * dy)

#initial condition
temp = np.full((nx, ny), temp_init)
time = 0.0

temp_old = np.zeros((nx, ny))

# Boundary condition
for i in range(nx):
    temp[i][0] = temp[i][1]
    temp[i][ny-1] = temp[i][ny-2]

for j in range(ny):
    temp[0][j] = temp[1][j]
    temp[nx-1][j] = temp[nx-2][j]

for i in range(nx):
    if i * dx <= 0.2:
        temp[i][0] = temp_bc

# graph data array
ims = []
fig = plt.figure()
ax = fig.add_subplot(1, 1, 1)

gx = np.zeros(nx)
for i in range(nx):
    gx[i] = i * dx

gy = np.zeros(ny)
for j in range(ny):
    gy[j] = j * dy

X, Y = np.meshgrid(gx, gy)

# time loop
for n in range(1, nt+1):
    # full-implicit with Gauss-Seidel
    for i in range(nx):
        for j in range(ny):
            temp_old[i][j] = temp[i][j]

    for iter in range(itermax):
        resd = 0.0
        for i in range(1, nx-1):
            for j in range(1, ny-1):
                tp = temp[i][j]
                temp[i][j] = 1.0 / (1.0 + 2.0 * ckx + 2.0 * cky) \
                    * (temp_old[i][j] + ckx * temp[i+1][j] + ckx * temp[i-1][j] \
                    + cky * temp[i][j+1] + cky * temp[i][j-1])
                resd += abs(temp[i][j] - tp)

        if resd <= eps:
            break

    # Boundary condition
    for i in range(nx):
        temp[i][0] = temp[i][1]
        temp[i][ny-1] = temp[i][ny-2]

    for j in range(ny):
        temp[0][j] = temp[1][j]
        temp[nx-1][j] = temp[nx-2][j]

    for i in range(nx):
        if i * dx <= 0.2:
            temp[i][0] = temp_bc

    time += dt

    if n % nout == 0:
        print('n: {0:7d}, time: {1:8.1f}, temp: {2:10.6f}, iter: {3:4d}'.format(n, time, temp[nx-1][ny-1], iter))
        im_contour = ax.pcolormesh(X, Y, temp.T, cmap='jet', vmin=0.0, vmax=100.0, shading='gouraud')
        im_time = ax.text(0, 1.05, 'Time = {0:8.1f} [s]'.format(time))
        ims.append([im_contour] + [im_time])

# graph plot
ax.set_xlabel('x [m]')
ax.set_ylabel('y [m]')
ax.set_aspect('equal')
fig.colorbar(im_contour)
anm = animation.ArtistAnimation(fig, ims, interval=50)
anm.save('animation.gif', writer='pillow')
plt.show()以下では注意する箇所だけ説明します。
完全陰解法のガウス=ザイデル法の部分
完全陰解法をガウス=ザイデル法で解くメイン部分です。
    for iter in range(itermax):
        resd = 0.0
        for i in range(1, nx-1):
            for j in range(1, ny-1):
                tp = temp[i][j]
                temp[i][j] = 1.0 / (1.0 + 2.0 * ckx + 2.0 * cky) \
                    * (temp_old[i][j] + ckx * temp[i+1][j] + ckx * temp[i-1][j] \
                    + cky * temp[i][j+1] + cky * temp[i][j-1])
                resd += abs(temp[i][j] - tp)
前回説明したように2次元配列 temp[i][j] を i、j でforループを回しています。
境界条件
境界条件は $y = 0.0$ (j = 0) でかつ $x \leq 0.2$ である点は、100℃に固定するディリクレ条件です。それ以外の点は断熱(ノイマン条件)なのでひとつ内側の点の温度を与えます。
    # Boundary condition
    for i in range(nx):
        temp[i][0] = temp[i][1]
        temp[i][ny-1] = temp[i][ny-2]

    for j in range(ny):
        temp[0][j] = temp[1][j]
        temp[nx-1][j] = temp[nx-2][j]

    for i in range(nx):
        if i * dx <= 0.2:
            temp[i][0] = temp_bc
ここでは、まず周囲全体に断熱の条件を与えています。板の端面に垂直な方向に対して、ひとつ内側の点の温度を与えるようにします。最後に温度固定の点の条件を与えています(※)。
※ 同じ点に重複して条件が与えられる場合、最後に定義した条件が有効になります。
温度コンター図の表示
2次元平面で温度が変化するようすをカラーの図にしてみます。このような図をコンター図といいます。
gx = np.zeros(nx)
for i in range(nx):
    gx[i] = i * dx

gy = np.zeros(ny)
for j in range(ny):
    gy[j] = j * dy

X, Y = np.meshgrid(gx, gy)
Pythonでコンター図を表示するには、まず $x$方向、$y$方向の座標点を生成します。gx、gy は1次元の配列で、$x$座標、$y$座標を計算して格納しています。
X, Y = np.meshgrid(gx, gy) は、格納した座標を元にコンター表示用の格子点を作成しています。
        im_contour = ax.pcolormesh(X, Y, temp.T, cmap='jet', vmin=0.0, vmax=100.0, shading='gouraud')
        im_time = ax.text(0, 1.05, 'Time = {0:8.1f} [s]'.format(time))
        ims.append([im_contour] + [im_time])
次に時間のforループ内で温度結果を出力していきます。
im_contour = ax.pcolormesh() は先ほど作った格子点とそれに対応するデータからコンター図を作る命令です。temp.T というのは温度の2次元配列 temp[i][j] の i と j を入れ替える操作です。コンターで出力する格子データは i と j が入れ替わった形をしているため、このようにしています。これで格子データ X、Y で temp.T のデータが色付けされて表示されます。cmap='jet' はカラーマップといってどのような色合いで表示するかを指定します。ここでは温度が低いと青色、高いと赤色で表示します。vmin、vmax はコンター図を表示するときの最小値、最大値のレンジを揃えるために指定します。shading='gouraud' はコンターを滑らかに表示するオプションです。
im_time = ax.text()のところは以前と同じで時刻を図の上部に表示しています。
ims.append([im_contour] + [im_time])はアニメーション用にコマを追加しています。コンター図のオブジェクトは配列の形で追加してください。
# graph plot
ax.set_xlabel('x [m]')
ax.set_ylabel('y [m]')
ax.set_aspect('equal')
fig.colorbar(im_contour)
anm = animation.ArtistAnimation(fig, ims, interval=50)
anm.save('animation.gif', writer='pillow')
plt.show()
時間ループを抜けたあと、図の他の要素を追加して動画ファイル出力と画面への出力を行います。
ax.set_aspect('equal')で図の縦横比を合わせています。
fig.colorbar(im_contour)は先ほどのコンター図にカラーバーを表示しています。
計算結果
ではPythonで計算実行してみてください。今回は2次元で計算点数が増えているので、少し時間がかかります。
上のプログラムでは、分割点数を nx = 51、 ny = 51、時間刻みを dt = 1.0、計算期間を tend = 10000.0 としています。
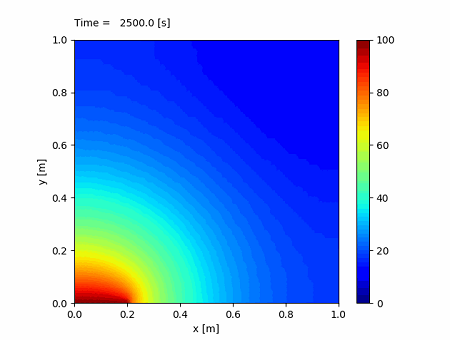
計算が終了すると次のようなコンター図のアニメーションが表示されるはずです。
左下の温度の高い領域から徐々に面全体へ熱が伝わっていき、温度が高い領域が広がっていく様子がわかると思います。
このように視覚的に捉えることができると、熱がどのように伝わっていくか一目瞭然です。もちろん、具体的な温度の値が知りたい場合は、その点の温度を出力させたり、以前やったようにファイルに出力させることもできます。
また材質を変えて比熱や熱伝導率が変わったとき結果がどう変わるかを見たり、境界条件を変えたときにどのようになるかを調べたりいろいろ応用することができます。
まとめ
今回で第3回目のシリーズ「熱伝導方程式のシミュレーション」は終了です。熱伝導という身近な問題を使って、空間や時間の離散化、差分法やさまざまな数値解法を学びました。ここで紹介した以外にもさまざまな数値解法やスキームがありますが、今まで学んだことを理解していれば、他の解法を理解するときに十分役に立つと思います。
また、ここまでできれば、他にもいろいろな問題をシミュレーションすることができるようになります。例えば、熱伝導方程式と同じ形をしている拡散方程式なども同様に解くことができます。これは濃度の高い領域が周りへ拡散していく問題です。また、流体の方程式に現れる拡散項や粘性項なども同じ形をしています。いろいろなものに応用できるので、プログラムを作っていろいろシミュレーションしてみてください。
